
Here you can view E-Learning Compliance authorization status across states, track the progress of authorization, view your expenditure across categories and years, review the activity calendar and also view visualize your state authorization data in more than one way.
Accessing Reports
1. The first step to access reports is to login into mentis.
2. Click on Reports on top navigation bar.
3. Once on Reports click on ELC Dashboard under Labs from the sidebar.
Authorization Status Across States
1. In Authorization Status Across States, you can view the availability of online programs across all the states.
2. The different shades of green colour i.e light and dark signifies the online programs which are authorised in a particular state. The states with no colour signifies that no online program is authorised in that state.
3. Mouse-over the map to see the availability of online programs in a particular state.
4. You can set a filter for a particular state by clicking on a particular state.
Note: By using reset button you can refresh the ELC Dashboard.

Authorization Progress
1. You can view your overall progress towards state authorization or click on a state in the first chart to view your progress towards state authorization in that state.
2. The green, yellow and red color in circular chart signifies the authorized, in progress and not authorized status respectively.
3. On mouse-over, you can view the number of programs with authorized, in progress and not authorized status.

Note: The priority for authorization progress is as Not Authorized > Authorized > Exempt > SARA Exempt > In Progress. If a program is having two authorization status from two state agencies in a particular state as "Not Authorized" and "In Progress" then the authorization progress chart will count it as "Not Authorized".
Category wise Expenditure
1. In Category wise Expenditure you can view a pie chart with the different category of expenditure like application, staffing, compliance and miscellaneous expenses.
2. On mouse-over, you can view the amount for a particular category of expenditure. And on clicking a particular category of expenditure you can view year-wise expenditure.

Note: Similar to the progress chart, this chart can also be filtered to a particular state by selecting a state from the first chart. The state for which is the data is being shown is visible in the top right corner of the chart box.
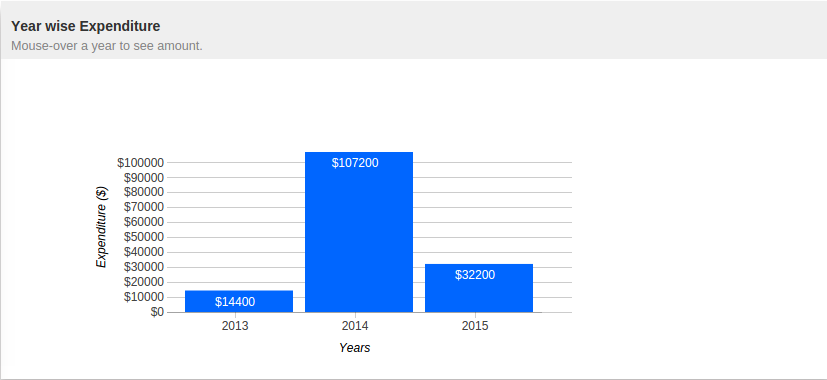
Year wise Expenditure
1. The Year wise Expenditure chart showcases the expense for a particular category in a different year. Further on mouse-over a year you can see the amount.
Status Explorer
Note: To view this chart, you need to filter the dashboard to a particular state by using the first chart.
1. In Status Explorer you can view a sunburst chart for all the online programs having authorized, in process and not authorized status for a particular state.

2. On clicking a particular authorization status, you can view the programs for particular authorization status for the particular state.

Note: To view status explorer please click and set a particular filter for a state in Authorization Status Across States map. In status explorer, on clicking the center circle you can come out of filter for particular authorization status or program.
State-wise cost versus processing time
1. In State-wise cost versus processing time showcases the fastest authorization processing and least expensive state. Mouse over the bubbles to see the name of the state and additional details for the state.

Activity Calendar
1. Mouse-over the dates to see details of the activity on that date.

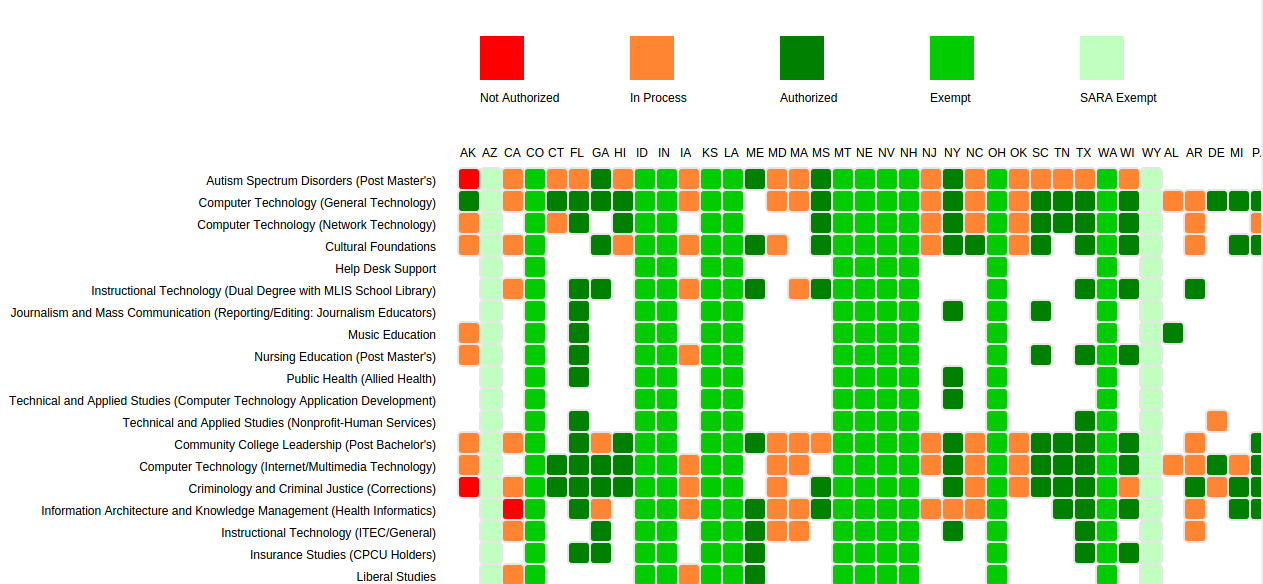
State and Program Status Matrix
1. In State and Program Status Matrix, you can view all programs across all states at a glance.
2. On mouse-over, you can view the particular state and program name.
Comments
0 comments
Please sign in to leave a comment.